GMD
1. Huge rallies begin from these conditions
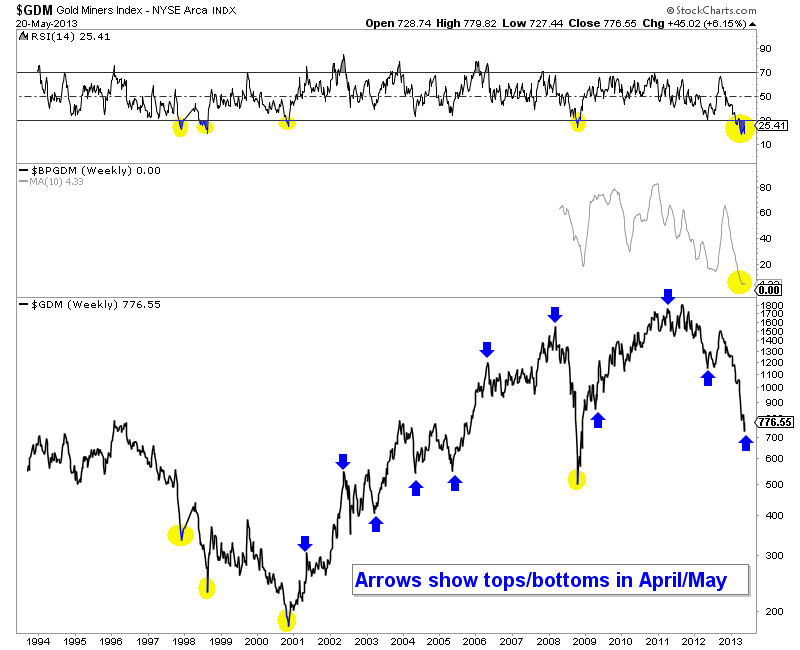
Below is the NYSE Gold Miners Index which is tracked by the GDX ETF. Look at the RSI. Not only did it reach a multi-decade low but it has remained oversold far longer than during the comparable periods. In the four previous periods, the market rebounded suddenly and strongly in percentage terms. Meanwhile, the bullish percent index, a breath indicator is more oversold than in 2008. We plot the indicator with a 10-week moving average that shows it as far more oversold than in 2008. While this indicator does not go back that far, odds are it is likely at a 13-year low.
2. Springtime is usually a turning point for gold stocks.
According to seasonal analysis, precious metals usually peak in the late spring. However, a study of the past 12 years shows that its more apt to say that spring is a turning point. In the above chart we mark the tops or bottoms that occurred in April or May. Assuming we are presently at a bottom then spring will have marked a turning point in gold stocks during 11 of the past 13 years.
3. A selling climax already occurred and the recent low is a false breakdown.
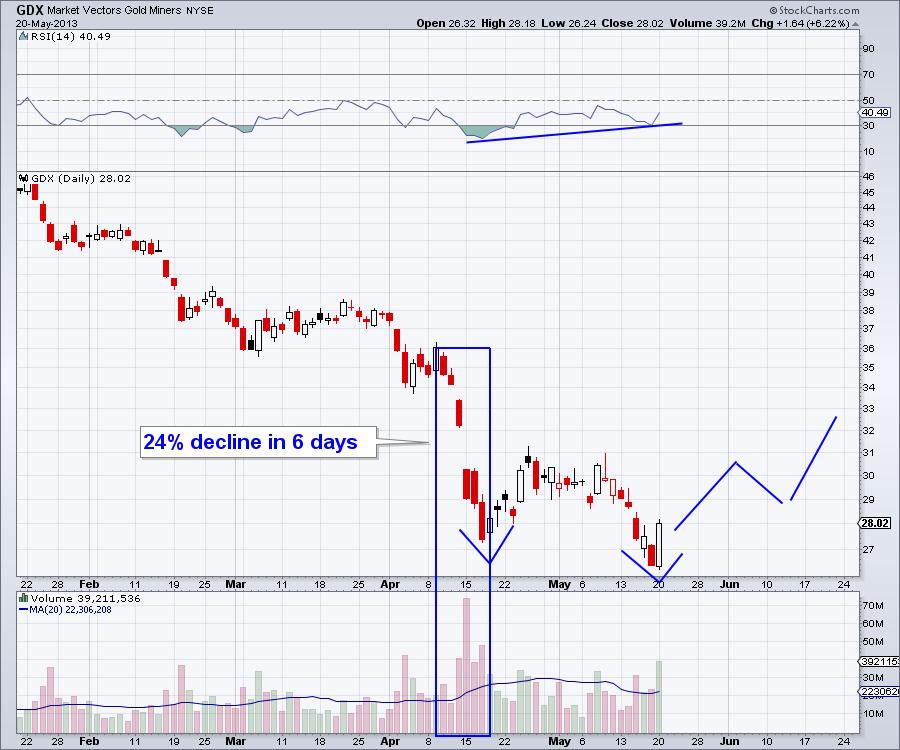
The selling climax occurred in April when GDX declined 24% in only six days. The 20-day volume average peaked days later at 30 million shares. The previous high was 21.5 million shares in June 2012. GDX has also formed a bullish RSI divergence and Monday reversed on record up volume. Prior to Monday, recent weakness was on average volume which was substantially less than during the selling climax. This is a subjective thought but this potential bear trap and false breakdown could be the retest. When you get a failed retest that is a trap or false move it can result in a V bottom. Look for a potential head and shoulders bottom or a V bottom. Finally, if the RSI pushes above 50 then that is a good sign.
GDX
4. History suggests the cyclical bear is just about over
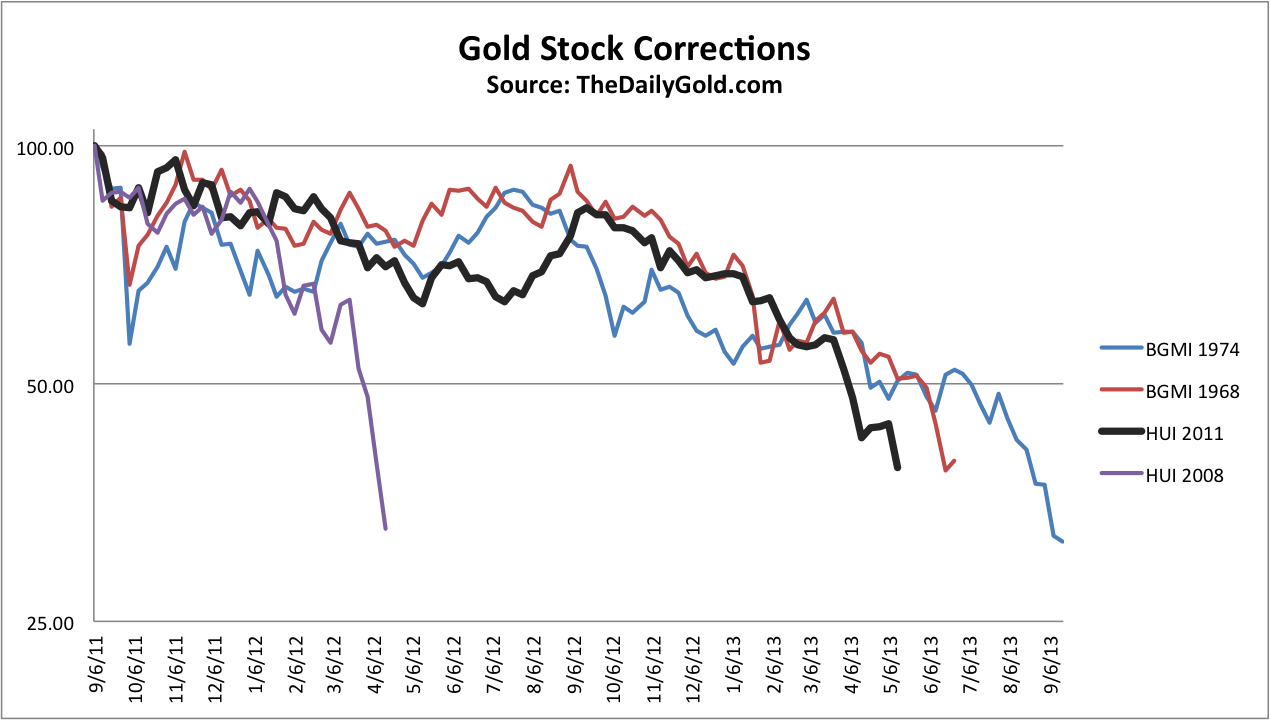
Each secular bull market in gold shares has endured two major cyclical bear markets. The chart below, which uses weekly data shows the four corrections. It is possible this correction could last a bit longer and move a bit deeper but in the big picture, the next big move is higher, not lower.
Gold Stock
5. There is potential for a huge short squeeze.
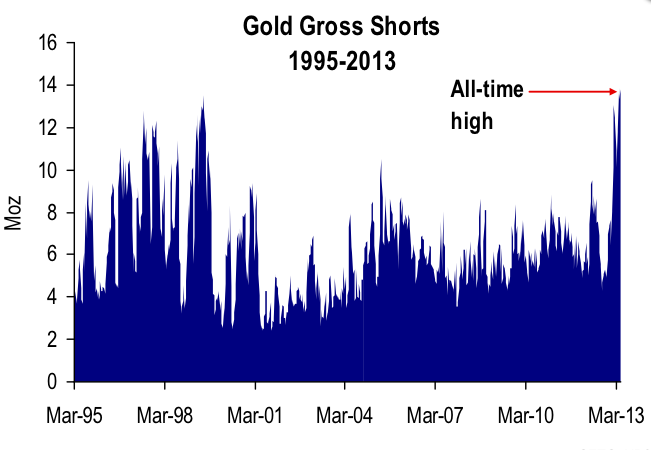
Gross short positions are at all-time highs. Some short positions were covered as Gold rebounded from its crash low at $1320. After the rebound fizzled short positions reached an all time high. Gold has formed a short-term double bottom. Without a doubt, short covering contributed to Monday’s huge reversal. If Monday’s rebound is sustained, look for a torrent of short covering to follow.
Gold Gross Shorts
6. Cyclical rebounds usually are huge in percentage terms
The chart below shows the first five months of performance of the cyclical bull markets within secular bull markets. The advances that began from the least oversold conditions were the least powerful. If the next rebound is similar to 2000 or 2008 then it will achieve more than 50% in the first five months.
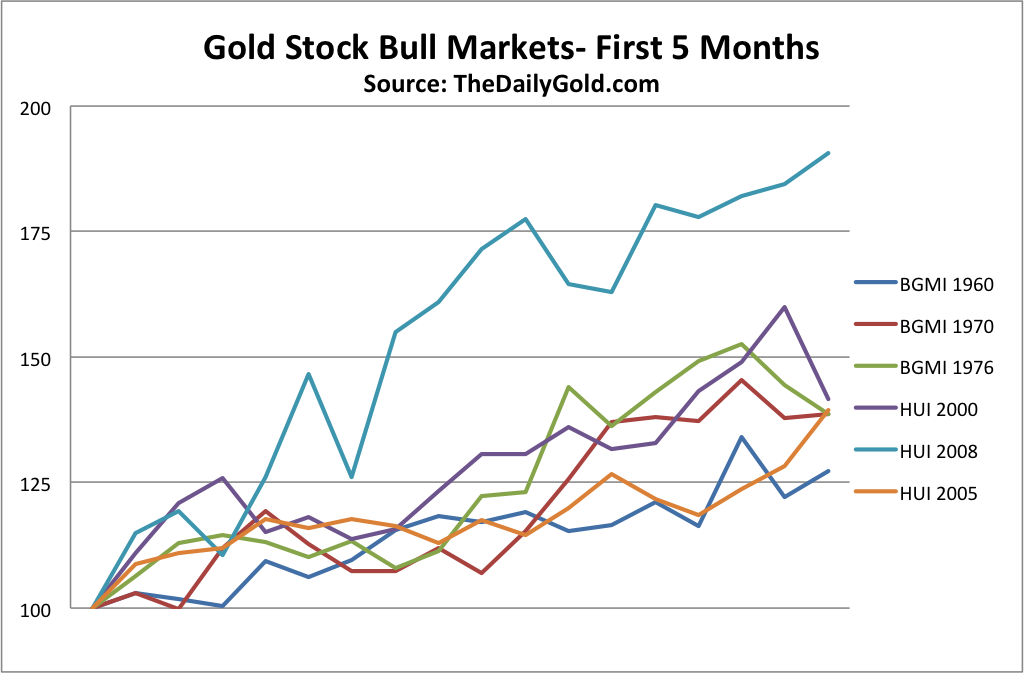
Gold Stock 2
There you have it. It’s been a tough road for precious metals but the path ahead has strong potential of being significantly profitable compared to these levels.
No comments:
Post a Comment