By Mingze Wu
USD enjoyed gains yesterday after 2 Fed officials, James Bullard and William Dudley, lent support to current QE purchase program, with Bullard saying that the Fed should continue its current program, and Dudley going one up and suggest that the Fed may adjust pace of asset purchases higher depending on the economic outlook. US stock rallied higher as the 2 aforementioned Fed members held voting rights, unlike the 2 Fed members John Williams and Charles Plossers who were rather vocal recently on their unhappiness over the QE program and want it to be shut down sooner rather than later.
Gold prices traded sharply lower during US trading session, showing once again that the yellow metal is driven by USD strength and not on QE inflation risks. This is a long known fact, but perhaps it is a timely reminder especially given that Ben Bernanke will be speaking later this evening (morning US hours) with regards to QE in Congress. Should Ben Bernanke maintain his dovishness tonight, it is likely that stocks will continue to rise, pulling USD along with it hence making Gold lower. However, if Ben choose to be hawkish (unlikely), there remains an outside chance that USD would still strengthen due to expected lower liquidity in the future, which would again drive Gold lower. This makes tonight’s event leaning favorably for Gold bears.
Hourly Chart
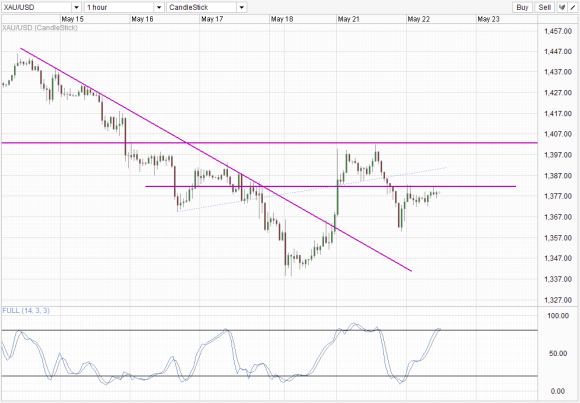
XAU/USD_1
From a technical perspective, a new short-term resistance has emerged around 1,382. Stochastic readings are also topping currently, increasing the resistance strength and suggesting that price may embark on a bearish cycle towards 1,350s and below. Support could be found via the descending trendline that has been in play since last Tuesday, but do not expect price to simply bounce higher from it, as there remains a chance that price may simply trade modestly lower along the trendline after tagging it especially given the strong bearish backdrop. Furthermore, it is likely that price may be trading below 1,330 and close to 1,300 when the descending trendline is tagged, which would represent an extension of bearish breakout on the weekly chart (see below) and makes bullish rebound on the short-term all the more unlikely.
Weekly Chart
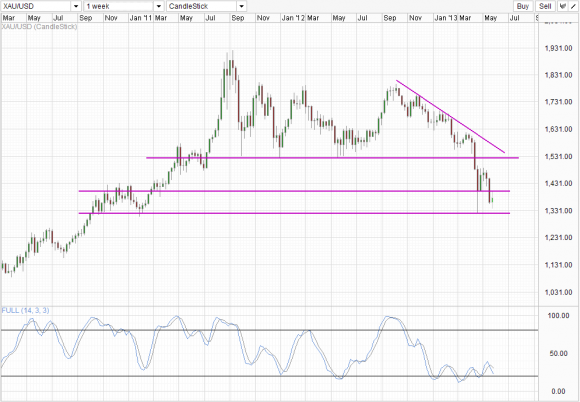
XAU/USD_2
From the weekly chart, price is caught in the center of the consolidation zone found between Sep ’10 to Feb ’11. If bulls are able to keep price around current levels for the rest of the week, they may be able to enjoy a nice reversal for next week as price would be showing a spinning top, the precursor for a potential bullish reversal. Also, the tail of the candlestick would be above the consolidation floor, which is a good bullish sign. However all these is contingent that price remain where we are currently, if we trade below the floor, then a case could be made for bearish acceleration towards 1,250 and potentially below 1,200.
Stochastic readings is still firmly bearish, with readings still pointing lower and having some space above the Oversold region. Hence we should not simply take the bullish reversal pattern before it is hatched, and continue to watch out for any continued bearish movements in the near future.
No comments:
Post a Comment